

The localization of the NV centers is performed by making use of an experimental setup that is based on confocal microscopy. After localizing the NV center, the single photon nature of the quantum emitter can be confirmed via correlation measurements, enabled by a small modification of the confocal setup. This page provides information on the basic principles of the confocal microscopy and the Hanburry Brown-Twiss (HBT) experiment, a correlation measurement to confirm the quantum nature of emitted photons.
At the bottom of the page, useful references are listed.
Principles of Confocal Microscopy
The setup used for the localization and characterization of NV centers is based on a confocal microscopy setup, which is used at room temperature.
The excitation light in fluorescence confocal microscopy is usually provided by a laser at a wavelength that excites the specific system under investigation. A model of a confocal microscopy setup is depicted in Fig. 1.1. The sample is irradiated using a laser, and the reflection and emission from the sample are detected.
An excitation beam is guided towards the sample using a dichroic mirror, then passes through an objective lens, which focuses the beam on a small region of the sample. The emission and reflection from this region travel back along the same optical path. The dichroic mirror acts as a low-pass filter for the photons: it reflects higher energy incident photons and allows lower energy fluorescent photons to pass, thus filtering out reflected excitation light.
After that, the light goes through a pinhole, which acts as a spatial filter. The role of the pinhole is to eliminate the scattered light, which yields to collection of light only from a highly focused point, thus allowing a 3D reconstruction of the analyzed sample site.
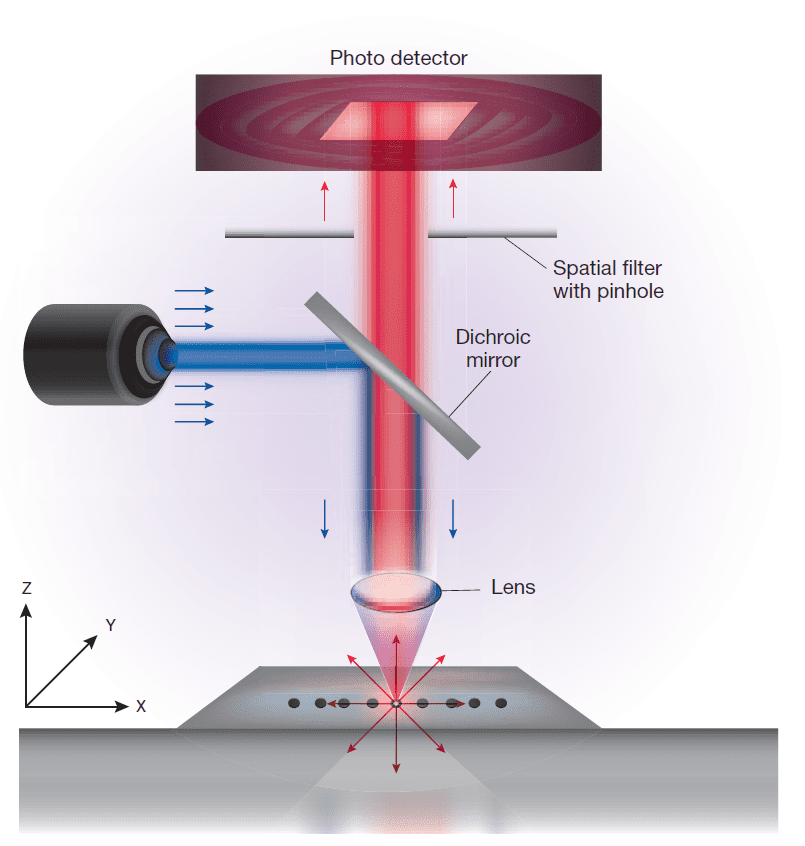
Fig.1.1: Illustration of a confocal microscope setup. Illustration taken from [2];
The Hanburry Brown-Twiss (HBT) Experiment and photon statistics
The following section is primarily based on the book Quantum Optics by Mark Fox. For an in-depth explanation of HBT experiments, please refer to reference [1].]. This section will cover the basic principles of the HBT experiment and photon statistics, providing clarity and direct applicability for the research practicum experiments.
The Hanburry Brown-Twiss (HBT) experiment has been originally performed in the field of astronomy, where it has been demonstrated that the coherence of two light beams can be understood by means of light intensity correlations. In quantitative measurements, the second order correlation function has been introduced as a figure of merit to describe the nature of light classically as shown in Eq.1.1:
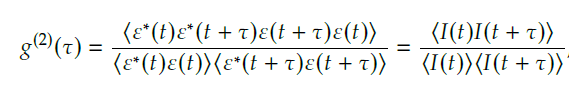
where ε(t) and I(t) are the electric field and intensity of a light beam at any time t. The <…> symbol indicates the time average over a long period. For a source with any conceivable time dependence, it is always the case that: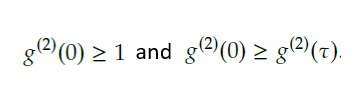 It can be concluded that, in the classical case, for any source with a time-varying intensity, the second order correlation function is expected to decrease with τ, reaching the value of unity with large τ.
To describe the quantum mechanical behavior of light, a simpler variant of the HBT setup can be considered, as shown in Fig. 2.2. Photons are sent through a 50:50 beam-splitter, after which half of the photons impinge on one photon detector D1 and half on a second photon detector D2. D1 is used to generate a start signal and D2 to generate a stop signal. The time tagger keeps track of the time between a photon arriving at D1 (start signal) and another photon arriving at D2 (stop signal), while simultaneously counting the number of photons arriving at the detectors. Results of such an experiment are typically presented in a diagram, which displays the number of counts at every value of time τ between a start and a stop signal. Because the number of photons impinging on a photon detector is proportional to the intensity of the light beam, the classical Equation1.1 can be rewritten as follows into Equation 1.2:
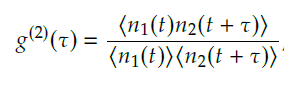
where n1(t) and n2(t) are the number of counts registered on D1 and D2 at time t, respectively.
When considering quantum mechanics, different results are possible than those discussed earlier in this section. Consider a light beam consisting of a stream of photons with long time intervals between them. When a photon arrives at the beam-splitter, there is a 50% chance of the photon going to D1 and activating the start sign. After a certain time τ, another photon arrives at the beam-splitter. With a 50% chance it goes to D2, activating the stop sign, which would add a count to the histogram mentioned earlier at time τ. If it would go to D1, no count is registered in the histogram and another time interval should pass before the next photon faces the same odds at another time τ. After every time interval there is a finite probability of D2 detecting a photon and activating the stop sign. At time delay τ = 0 however, it is impossible for a photon to activate the stop sign and thus for a count to be considered in the histogram, as the photon considered at this time period is at D1 already. The light considered here is called anti-bunched, as there are long interval times between the arrival of consecutive photons. A key characteristic of anti-bunched light is g(2)(0) < 1, which is not possible when considering a classical light beam. This knowledge can be used to identify single photon-emitters, such as NV centers, for which the modelling autocorrelation function is expressed below:

where K, k1 and k2 are fitting constants obtained from the solutions of the rate equations for the three-level NV system, which takes into account relaxation through the singlet-levels.
A typical second order correlation function of an NV center, after having localized the bright spot and measured the spectrum (Fig.2.1) follows the behavior in Fig.2.3.
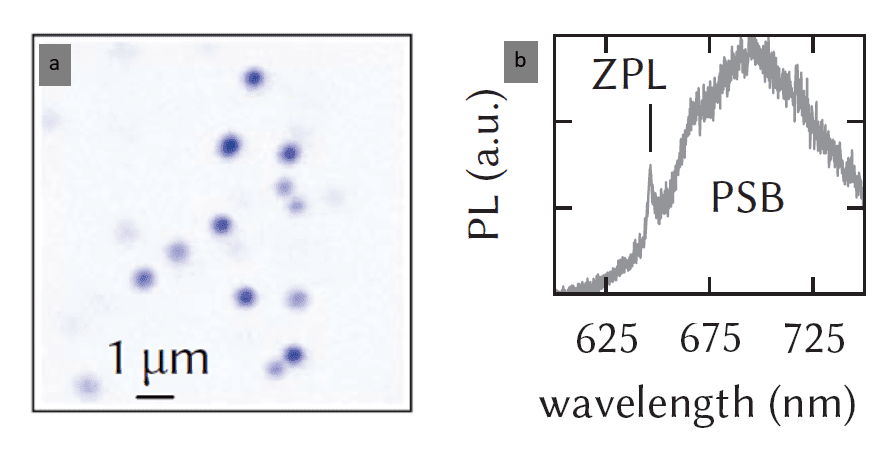
Fig.2.1: (a) Example of a PL map acquired with a confocal microscope; (b) Typical NV emission spectrum with a clear ZPL line at 637 nm. Figures taken from [4]
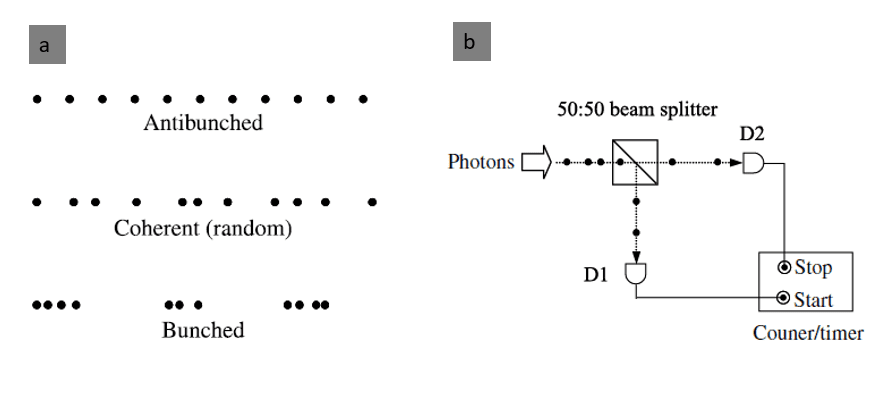
Fig.2.2: (a) Comparison of the photon streams for anti-bunched light, coherent light, and bunched light. For the case of coherent light, the Poissonian photon statistics correspond to random time intervals between the photons.; (b) HBT experiment schematics: the photons are sent through a 50:50 beam-splitter, after which half of the photons impinge on one photon detector D1 and half on a second photon detector D2. The pulses from the single-photon counting detectors D1 and D2 are fed into the start and stop inputs of an electronic counter/timer. The counter/timer both counts the number of pulses from each detector and also records the time that elapses between the pulses at the start and stop inputs. Figure adapted from [1].

Fig. 2.3: Typical fluorescence intensity autocorrelation function of a single NV defect at room temperature. If a bright spot identified in a PL shows such a photon counting with antibunching at τ = 0 and bunching around that, this is a clear indication that the source behaves as a single-photon emitter. Figure taken from [3].
List of references:
For further details, please consult the following references:
- M. Fox, Quantum optics: an introduction. Vol. 15. Oxford university press (2006). https://qsip.sjtu.edu.cn/__local/E/7B/2E/C785A765BB490B0C1EE0F8B8100_DD9B46CD_32A19D.pdf
- A. Nwaneshiudu et al., Introduction to confocal microscopy, Journal of Investigative Dermatology 132.12, 1 (2012). https://www.jidonline.org/action/showPdf?pii=S0022-202X%2815%2935553-6
- F. Jelezko and J. Wrachtrup, Single defect centres in diamond: A review, physica status solidi (a) 203.13, 3207 (2006). https://onlinelibrary.wiley.com/doi/epdf/10.1002/pssa.200671403
- H. Bernien. Control, measurement and entanglement of remote quantum spin registers in diamond, Doctoral thesis, Delft University of Technology (2014). https://repository.tudelft.nl/islandora/object/uuid:75130c37-edb5-4a34-ac2f-c156d377ca55?collection=research